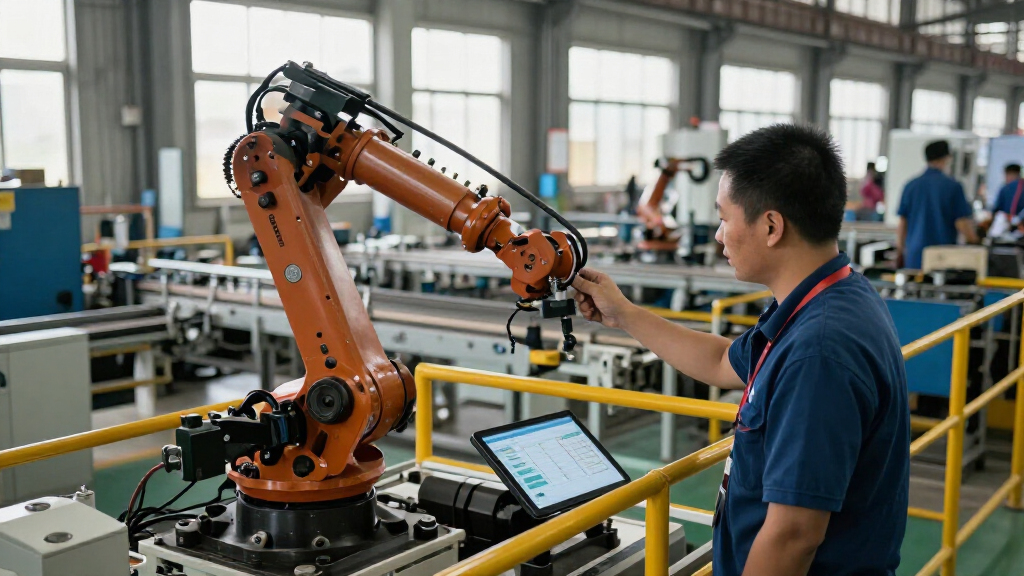

🔍 Read the full analysis: The Rise Of AI And The Retreat Of Factory Work on ThorstenMeyerAI.com

Get business pricing on office and shipping supplies
- Business-only prices and quantity discounts
- Tax-exempt purchasing
- Multiple users, one account, clear invoices
TL;DR
A report published November 8, 2026, traces the long decline in factory employment in the United States and compares it with Germany and China. U.S. manufacturing employment was 12.7 million in October 2026, preliminary, down 35% from its 1979 peak, while factory output was nearly twice its 1979 level but remained below its 2007 high. The source says automation and trade are part of the story, but does not establish AI as the cause of the historical decline.
U.S. factory employment stood at 12.7 million in October 2026, a preliminary figure 35% below its June 1979 peak, even as manufacturing output remained nearly twice its 1979 level, according to a report published November 8 by ThorstenMeyerAI.com. The report tracks factory employment across the United States, Germany and China and examines the causes of the decline; its historical figures do not establish that artificial intelligence drove the losses.
The U.S. peak was 19.553 million manufacturing payroll jobs in June 1979, in the Bureau of Labor Statistics series that begins in 1939. By October 2026, factories accounted for 8.0% of U.S. payroll jobs, compared with 21.7% in June 1979. The report distinguishes that employment share from the total number of jobs: manufacturing’s share peaked much earlier, at 38.8% in November 1943.
The report compares employment with the Federal Reserve’s manufacturing production index, adjusted for prices. The index rose from 50.4 in June 1979 to 98.4 in September 2026, or 1.95 times its earlier level. That calculation does not measure output per worker’s hours, and the report describes its comparison of output and job counts as rough. It also notes a limit to the long-run growth: production peaked at 108.6 in December 2007 and was about 9% below that high in September 2026.
Job losses were particularly steep from January 2000 to February 2010, when U.S. manufacturing employment fell from 17.3 million to 11.4 million, a decline of almost six million. The source says economists estimate that rising Chinese imports cost up to about one million U.S. factory jobs from 1999 to 2011. That estimate covers only part of the period and is not a complete accounting of the causes. The material supplied does not quantify job losses attributable to AI.
Fewer Factory Jobs, Different Output
The figures show why factory employment and industrial production should not be treated as the same measure. U.S. factories employed fewer people in 2026 than at the 1979 peak, yet the production index was nearly twice its 1979 level. That divergence matters to workers and communities: a growing or sustained volume of production does not, by itself, mean manufacturing is restoring its former share of jobs.
The historical comparison also cautions against assigning a single cause to factory job losses. The report discusses import competition and longer-term structural change, while its figures show employment fell across decades and through several economic downturns. Although the subject is framed around AI and factory work, the supplied data do not isolate AI’s effect. Any claim that AI explains the retreat would go beyond the evidence presented.
For readers following industrial policy, the distinction affects how recovery claims are judged. Output, employment and employment share describe different outcomes. The source also reports that output has not returned to its 2007 high, so the period since that peak does not fit a simple account of steadily rising production alongside declining staffing.
Popular right now

Sony WH-1000XM4 Wireless Noise-Canceling Headphones, Silver

Dyson R3 Nurovi Spot+Scrub UV Robot Vacuum

Bose QuietComfort Ultra Headphones (2nd Gen), Wireless Noise-Cancelling Over-Ear Headphones, Black
As an affiliate, we earn on qualifying purchases.
From the 1979 Employment Peak
The report uses the BLS Current Employment Statistics series, which counts jobs on employer payrolls outside farming. It excludes self-employed people and workers in private households. The series begins in January 1939, when factories had about 9.1 million jobs, or 30.3% of payroll employment. During World War II, factory employment and its share rose sharply; the share reached 38.8% in November 1943.
After the war, factories’ share of payroll jobs declined, but the number of factory jobs continued to rise as the overall economy expanded. It reached about 18.4 million in January 1970 and then its series high in June 1979. The report notes that the share and the job count peaked at different times: the share in 1943, the count 36 years later.
Factory employment fell during the early-1980s recessions, partly recovered, and then declined again. The report describes Germany and China as having passed employment peaks too. Germany’s figures cover the broader producing sector, including construction, energy, water and mining, rather than manufacturing alone: that sector represented 22.9% of employment in 2025. China’s industry and construction employment reportedly peaked at 232 million in 2012. These measures are not directly interchangeable with the U.S. factory payroll series.
“The number to remember is 19.6 million.”
— Thorsten Meyer, ThorstenMeyerAI.com report
The figures establish long-term changes in employment and output, but they do not identify how much of the decline resulted from AI, other automation, trade, recessions or shifts in demand. The supplied material gives no direct estimate of AI-related factory job losses or a method for separating AI’s effects from other forces.
The October 2026 U.S. employment count is marked preliminary, and later revisions could change it. The output-to-employment comparison is also approximate: it compares an output index with job counts, not hours worked or the number of workers’ tasks automated. The source says Chinese import competition cost up to about one million jobs in 1999–2011, but the estimate is not presented as a full explanation for the almost six million jobs lost during the broader 2000–2010 decline.
International comparisons require care. Germany’s measure includes construction and other industries, while the U.S. figures refer to manufacturing payroll jobs. The supplied material provides only limited detail on China’s employment measure and does not establish how the countries’ series align.
Watch Revisions and New Data
The immediate next step is to watch for revisions to the October 2026 BLS employment estimate and for subsequent monthly payroll data. Those releases will show whether the preliminary figure of 12.7 million holds and whether factory employment is rising or falling.
Further evidence would be needed to answer the report’s AI question: sector-level data linking technology adoption with employment, hours, output and job tasks, alongside methods that distinguish AI from trade and other changes. The report’s current figures provide a long historical baseline, but do not settle how much AI is changing factory staffing now.
For the output comparison, future Federal Reserve production readings will indicate whether manufacturing moves back toward its December 2007 peak. Employment and production may continue to follow different paths; the available figures do not say whether either trend will reverse.
Key Questions
How many Americans worked in factories in October 2026?
The report gives a preliminary estimate of 12.7 million U.S. factory payroll jobs for October 2026, equal to 8.0% of payroll employment.
When did U.S. factory employment peak?
In the BLS series cited by the report, manufacturing employment peaked at 19.553 million in June 1979. The manufacturing share of payroll jobs peaked earlier, at 38.8% in November 1943.
Does the report show that AI caused factory job losses?
No. It describes changes in factory employment and output but does not measure AI’s contribution or separate it from trade, automation and other causes.
Did U.S. factory output keep rising as employment fell?
Between June 1979 and September 2026, the manufacturing production index rose to 1.95 times its 1979 level. However, the index peaked in December 2007 and remained about 9% below that peak in September 2026.
How much did Chinese imports contribute to U.S. factory job losses?
The report cites economists’ estimates that rising Chinese imports cost up to about one million U.S. factory jobs from 1999 to 2011. It also notes that the U.S. decline began before China joined the WTO, and does not treat imports as the sole cause.
Source: ThorstenMeyerAI.com